Graph-based Semantic Measures
Numerous ontologies formalise knowledge of specific domain to make it sharable and workable by both human experts and software agents. These ontologies are today widely adopted to characterise various entities (e.g. documents, genes, diseases) through non-ambiguous meaning. To take advantage of such a valuable knowledge, an increasing number of algorithms rely on semantic measures to evaluate the proximity of entities according to their representation in a semantically characterised domain.
In short, graph-based semantic measures aim at comparing either concepts (sometimes terms) or instances represented as vertices of a semantic graph. Because of their importance in numerous domain-specific applications, a plethora of ad-hoc graph-based semantic measures has been defined. The SML implements numerous existing measures and proposes numerous algorithms commonly used for their development. In this page, we briefly discuss the data model which is used in the library. We also present an example of use of graph-based semantic measures and we discuss some technical details regarding these measures.
The graph data model used in the library
In the literature graph-based semantic measures have been applied on multiple types of graph representations. The SML adopts a simple graph data model compatible with most of the graph representation used in theoretical expression of semantic measures. In short the library considers a graph of identifiers (URIs) which are used to refer to specific concepts or instances.
The data model considered by the library is a graph $G=<V,E,R>$ with $V$ the set of URIs which refers to specific elements (concepts, instances, predicates), $E$ the set of oriented edges linking pairs of URIs according to a specific type of relationships (predicates) and $R$ the set of predicates which can be used. Each edge is a triplet of URIs which is oriented, and unique.
As an example the graph model adopted by the library can be used to represent the simple (RDF) graph represented in Figure 1 as each node can be identified by a unique identifier and oriented edges are labeled by a particular semantic relationship.
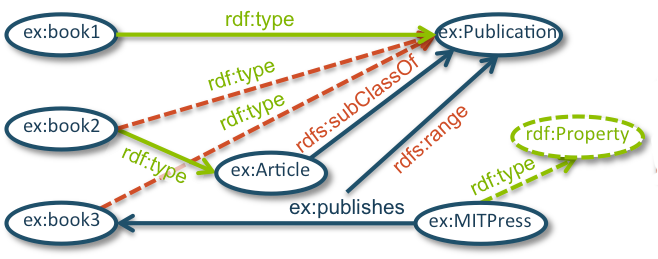
Figure 1: Example of semantic graph (RDF Graph), figure modified from W3C website.
For those who are not familiar with semantic graph, in a ‘very’ simplified manner, we can say that the purpose of such semantic graph is to model a domain defining a set of concepts and the semantic relationships established between them. As an example, if one wants to represent the various genres of music it will probably define that alternative rock is a subgenre of rock and thus create two vertices representing the two genres and link alternative rock to rock with an edge of type “is a subgenre”. The definition of such knowledge representations is driven by numerous researches involving various scientific communities; the scope of this document is not to introduce you to the various existing formalisms. Please refer to documentation related to (lightweight) ontologies for further information. In the following documentation we sometimes refer to such graph knowledge models as the schema layer of the knowledge base (TBox).
Once the knowledge about music genres is represented through a semantic graph, various instances (e.g. records, artists) can be annotated to it. The set of instances is defined by $I$. Instances are realization of abstract class; John Lennon is a realization of the class Musician as we can say that John Lennon is of type Musician. As John Lennon was a Rock and Pop musician (according to Wikipedia), one can reduce our knowledge of this specific artist to the set of music genres he contributed to and thus simply decide to represent a musician through the set of music genres it is associated to. Such a representation can therefore be used to compare instances, or to search the more relevant artist according to a specific query. In this example, we will consider such a reduction of an instance in order to focus to semantic measures which have been defined to compare groups of concepts - more complex measures can also be used, e.g. in order to consider an instance as a node of the semantic graph (not only as the set of concepts it is linked to). Note, that music bands can be replaced by any type of elements (books, receipes, products), which have been characterised by concepts defined in a taxonomy of concepts.
The representation of instances is abstracted, they can be defined as node of semantic graph establishing relationships with concepts e.g. John Lennon played Rock or not be stored in the graph but rather in a classical relational database only associating to an instance a set of concepts. In fact, the simplest graph-based semantic measures only require an instance to be represented (annotated) through a set of concepts $V'\subseteq V$. The SML currently consider instances as graph vertices but full abstraction is planned for the next versions. You can also easily only store the concepts and only compare groups of concepts using the library.
Figure 2 represents an example of knowledge base which distinguishes a semantic graph structuring a set of concepts (represented as dot interlinked through relationships) and a set of instances (here documents) which are annotated by some of the concepts structured in the semantic graph.
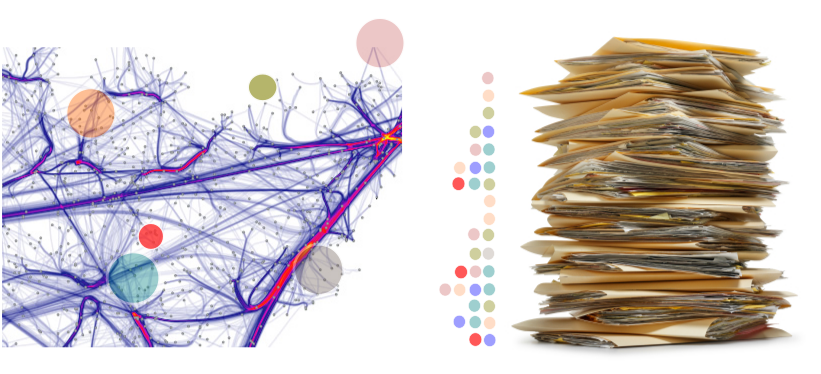
Figure 2: Knowledge base composed of a semantic graph and a set of instances (documents) annotated by concepts defined in the semantic graph (colored spots)
For those interested in the compatibility with the SML graph data model and RDF (Resource Description Framework), please refer to the dedicated subsection in the technical discussion.
Use case example
This section briefly presents a basic simplified use case in which graph-based semantic measures can be useful in a pretreatment of an information retrieval system (IRS). The aim of the IRS is to retrieve relevant documents according to a query composed of a set of concepts.
Figure 2 represents the knowledge base considered in the example, a semantic graph which structures a set of concepts (left) and a collection of documents annotated by concept(s) defined in the graph (right). Therefore, for each document is associated a set of concepts.
Considering a particular query composed of a unique concept, let’s say "Vehicle", represented by the red dot in Figure 3, a basic IRS will only return the three documents colored in red: those annotated by the concept specified in the query. However one can argue that the user could also be interested in documents talking of concepts similar or related to the one specified in the query e.g. "Car".
Thus, using a semantic measure, a preprocessing could elect a set of concepts highly similar to the one specified by the user, for example those contained on the light red area in Figure 3.
It can be considered that, thanks to the semantic query extension driven by the semantic measure, interested concepts are now those represented by red and blue dots.
The IRS will thus consider as relevant documents, according to the new set of concepts, those annotated by either red or the blue concept.
In this example, we have seen how using semantic measures implemented in the Semantic Measures Library, a simple ontology or knowledge organization system such as a taxonomy of concepts, can be used to design a conceptual information retrieval system in order to query specific instances annotated by concepts - by taking advantage of the semantics defined in the ontology.
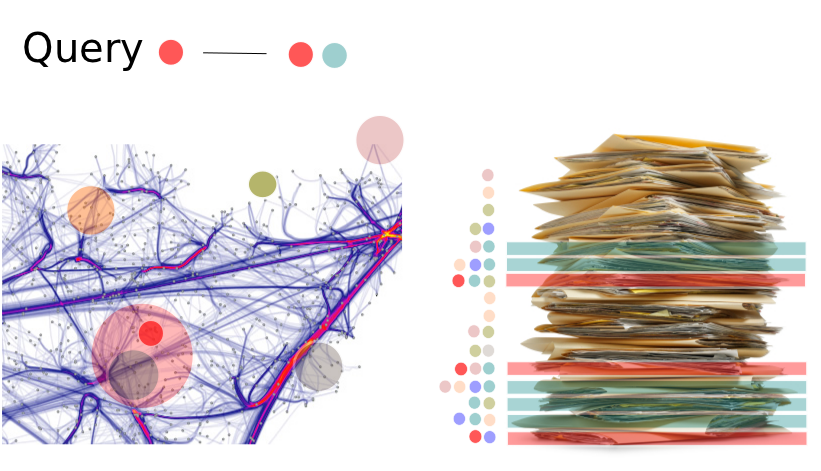
Figure 3: Query extension using a semantic measure
Technical information
For a details presentation of graph-based SMs and a listing of existing measures consult the technical section.
